Integrating Datadog with Camunda 7 on Windows and macOS
Modern workflow systems need strong observability. While Camunda 7 is powerful for orchestration, it lacks built-in APM visibility. This is where Datadog helps by providing tracing, monitoring, and performance insights.
📌 Why integrate Datadog with Camunda?
- Monitor workflow execution performance
- Trace service calls across processes
- Identify bottlenecks and failures
- Improve production debugging
- Enable full observability
🧩 Architecture Overview
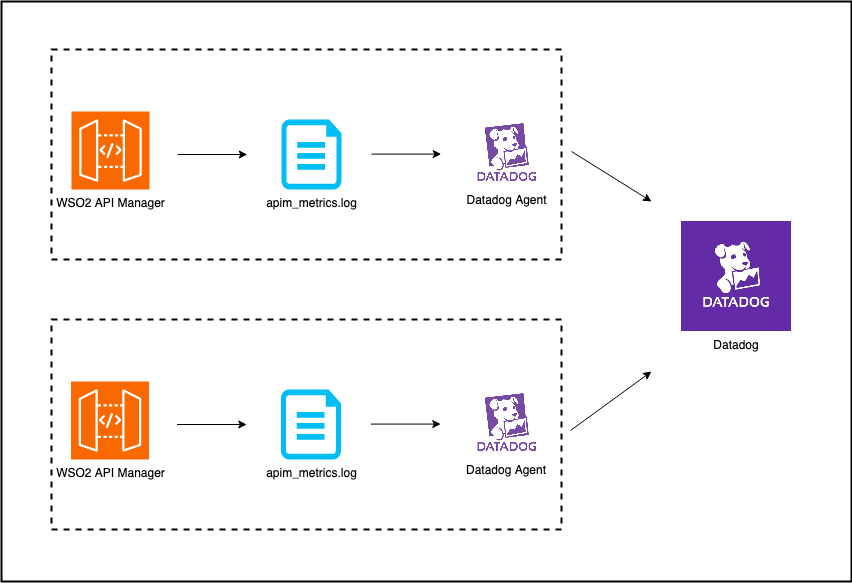
Flow:
Camunda → Java Agent → Datadog Agent → Datadog Dashboard
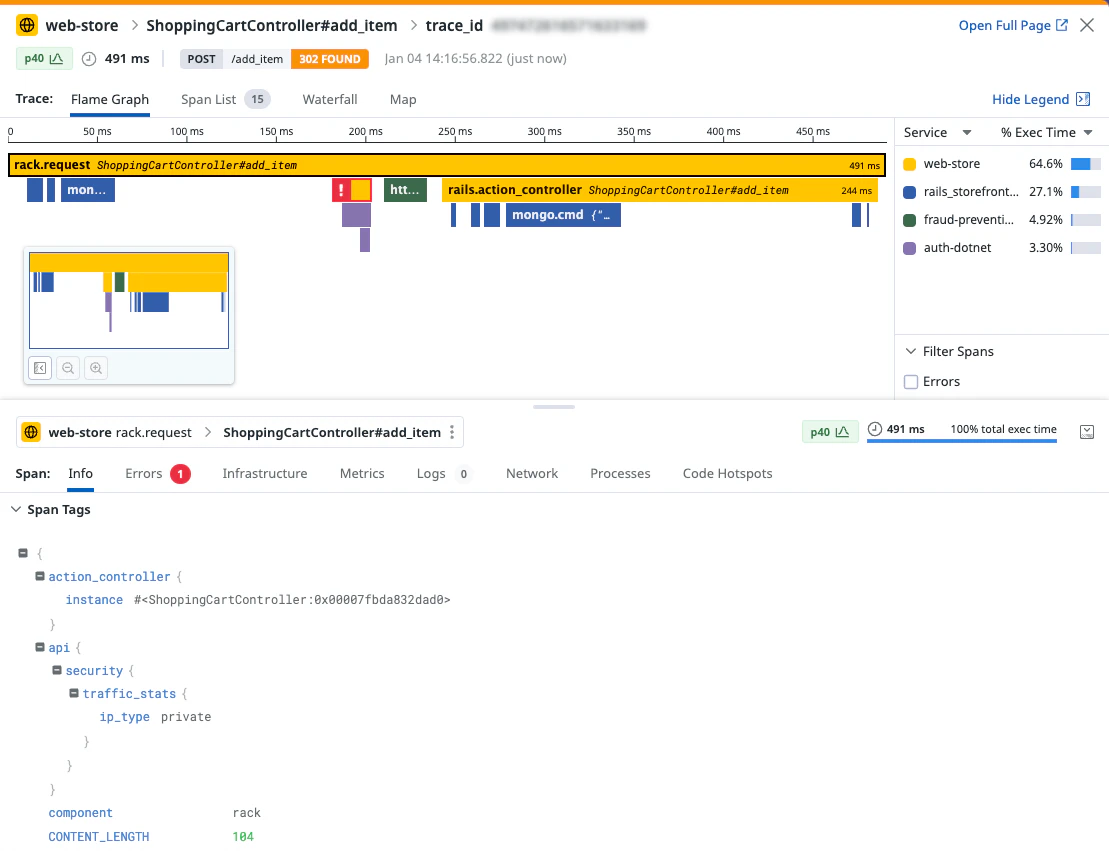
🔍 How Datadog Tracing Works
The Datadog Java agent automatically instruments your Camunda application and captures:
- HTTP requests
- database queries
- workflow execution spans
- external service calls
🔧 Prerequisites
- Camunda 7
- Java 11+
- Datadog account
- Datadog Agent installed
🪟 PART 1: Windows Setup
1️⃣ Install Datadog Agent
Install from Datadog UI using your API key.
2️⃣ Download Java Agent
C:\datadog\dd-java-agent.jar
3️⃣ Update start.bat
set JAVA_OPTS=%JAVA_OPTS% ^
 -javaagent:C:\datadog\dd-java-agent.jar ^
 -Ddd.service=camunda7 ^
 -Ddd.env=local ^
 -Ddd.version=1.0 ^
 -Ddd.logs.injection=true
4️⃣ Start Camunda
startup.bat
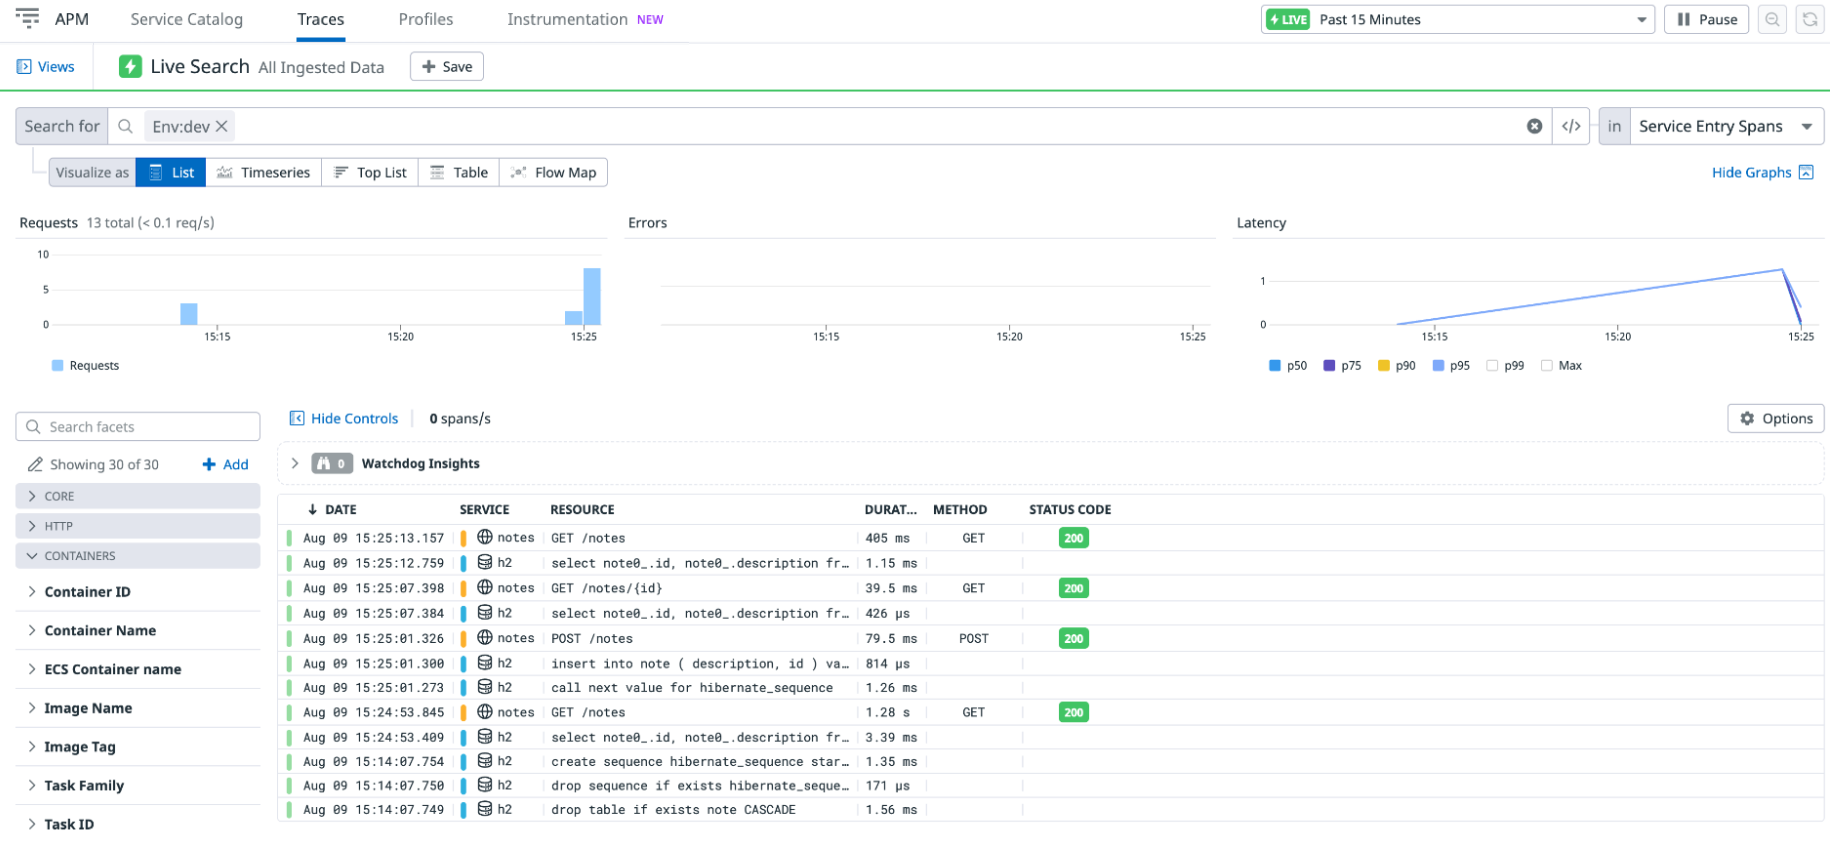
5️⃣ Verify in Datadog
Go to APM → Services
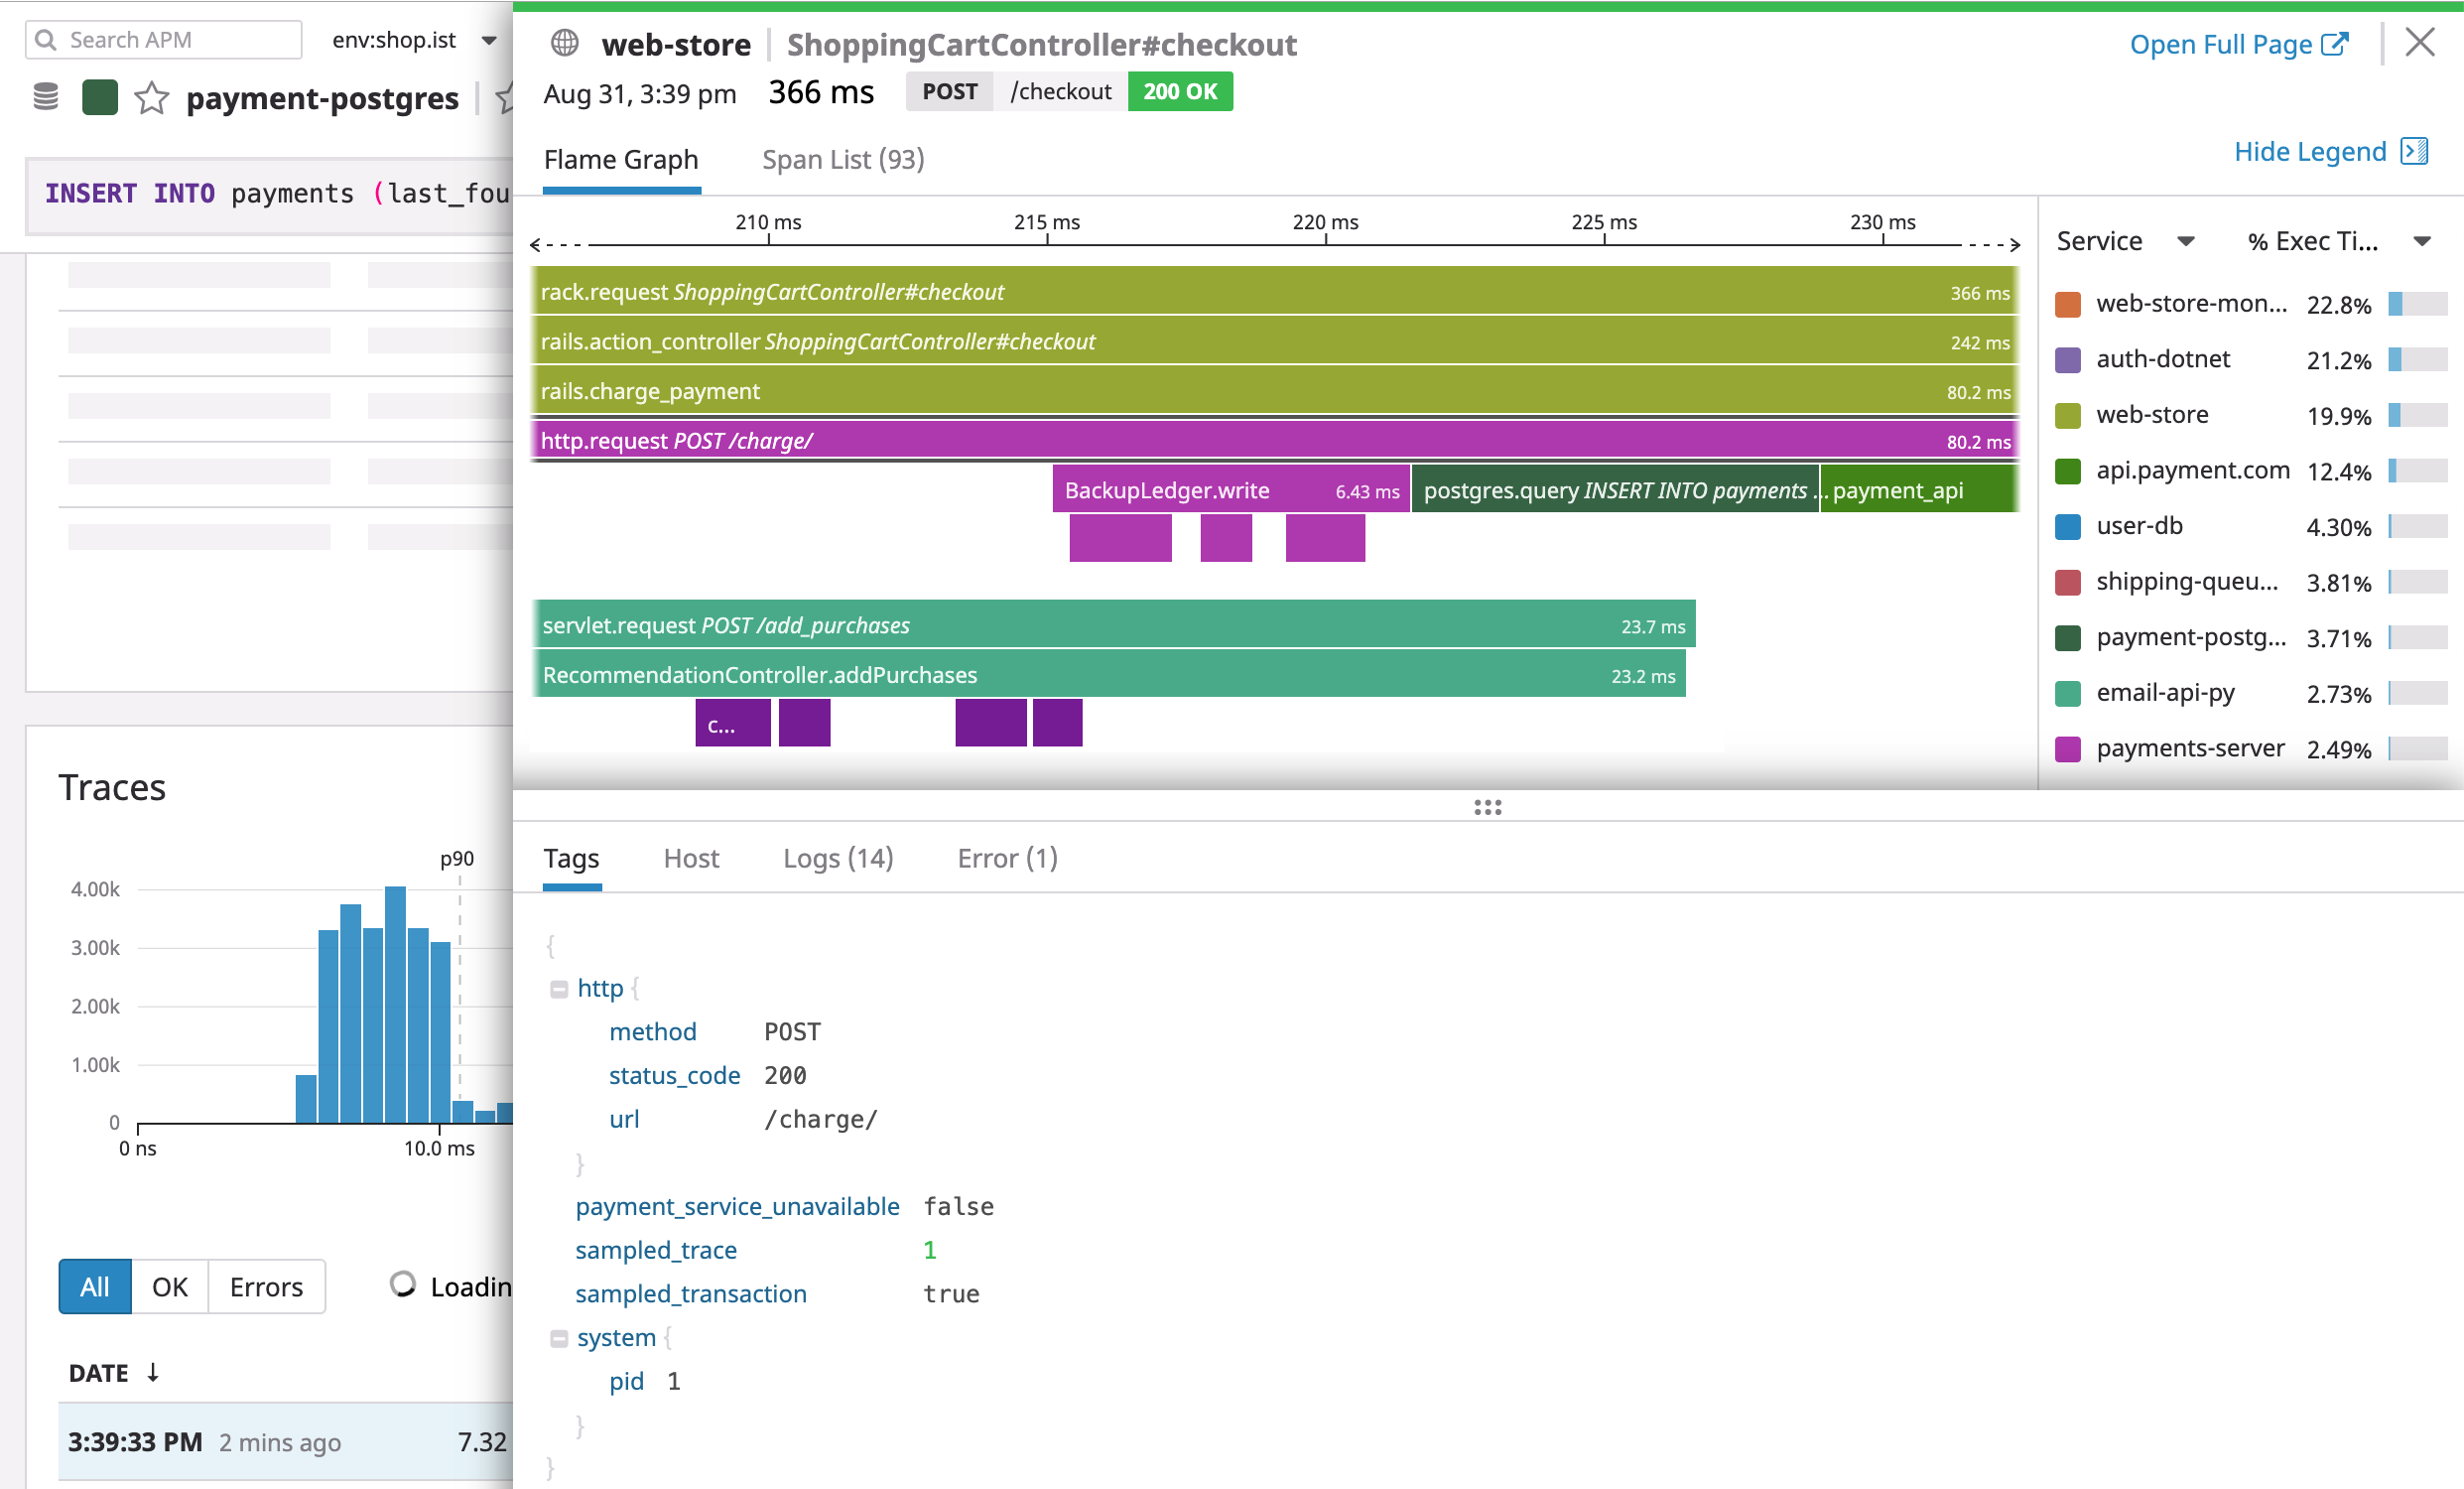
📊 Datadog APM View
Here you can:
- see request flow
- identify slow spans
- debug workflow latency
🍎 PART 2: macOS Setup
1️⃣ Install Agent
DD_API_KEY=your_api_key bash -c "$(curl -L https://s3.amazonaws.com/dd-agent/scripts/install_mac_os.sh)"
2️⃣ Download Java Agent
mkdir -p ~/datadog
cd ~/datadog
curl -L -o dd-java-agent.jar https://dtdg.co/latest-java-tracer
3️⃣ Set JAVA_HOME
export JAVA_HOME=$(/usr/libexec/java_home)
4️⃣ Update Startup Script
export JAVA_OPTS="$JAVA_OPTS \
 -javaagent:/Users/your-user/datadog/dd-java-agent.jar \
 -Ddd.service=camunda7 \
 -Ddd.env=local \
 -Ddd.version=1.0 \
 -Ddd.logs.injection=true"
5️⃣ Start Camunda
./startup.sh
🔬 Custom Tracing (Advanced)
You can also create custom spans inside your Java delegates:
Span span = GlobalTracer.get().buildSpan("camunda.custom.logic").start();
try {
   // business logic
} finally {
   span.finish();
}
📈 Metrics & Tagging
Use tags like:
-
processKey -
businessKey -
env
This helps in filtering and analysis.
🔍 What You Can Monitor
- Workflow execution time
- API latency
- Database queries
- External service calls
- Errors and retries
⚠️ Common Issues
- Agent not running
- Wrong path to jar
- No traffic generated
- JAVA_HOME not set
💡 Best Practices
- Keep BPMN clean (avoid heavy inline JS)
- Use Java delegates for orchestration
- Use Node.js for connectors
- Enable log correlation
🎯 Conclusion
Datadog integration with Camunda 7 gives you production-grade observability with minimal effort. It helps teams detect issues early, optimize workflows, and maintain system reliability.
📚 Recommended Articles
👉 Camunda Parallel Gateway Explained
👉 Camunda Incidents vs Errors vs Failures
👉 Long Running Processes in Camunda
👉 Jira vs Jira Service Management


Comments
Post a Comment